Meta confused me, and I am not afraid to admit it.
I thought running Value Optimization (VO) alongside a bid cap for a direct purchase app was clever. Early on, back in January, it seemed to work. tROAS was not spending, while VO and the bid cap were delivering solid ROAS.
Then February happened. March was worse.
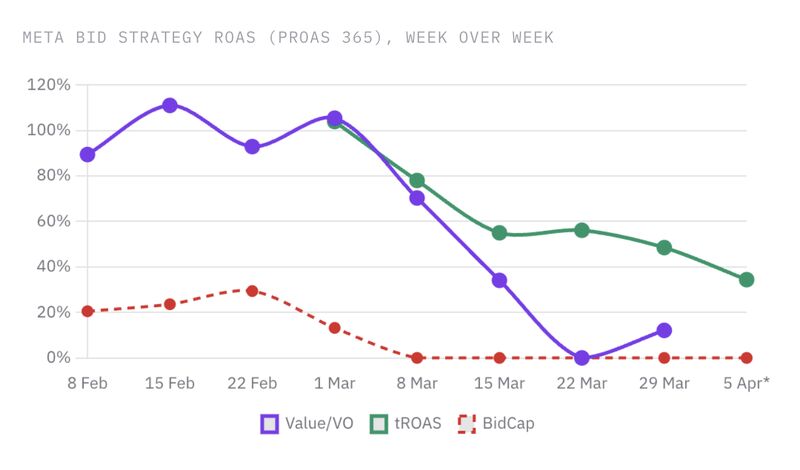 Weekly PROAS 365 by bid strategy on one direct purchase app. Value optimization in purple, tROAS in green, bid cap dashed in red.
VO fell off a cliff. I scrambled and tried a lot of things. Eventually I found stability again in tROAS, which held between 34% and 56% over the same weeks that VO went to zero.
What I take from it
The bid cap was the first thing to go quiet, dropping to zero from the second week of March and never recovering. VO followed a few weeks later.
What made this hard to read in real time is that VO’s best weeks came first. When a strategy runs mostly above 100% in its first month, you attribute it to the setup instead of the conditions. The collapse then looks like something breaking. The more likely reading is that the conditions that made it work were never permanent.
Will VO ever work for me again on this account? I do not know. I will test it. But it is not where the budget sits while tROAS is holding.
If you are running a similar setup, do not judge the strategy by its level alone. Watch whether it holds that level once the account changes around it. On tROAS, one way I watch for that is hit rate, meaning how many days Meta delivered the target I set.
One caveat on the chart: PROAS 365 is the return projected over 365 days, not cash received. A young cohort or a model revision can move it, so I would check the zero weeks against spend and event delivery before reading them as zero value. This is one account. The chart shows that the collapse happened and does not explain why.