In week 1 on Meta, a casual game hit £4 CPI on iOS with 27% D0 ROAS and 10% D1 conversion, and everything looked incredible. I still call it the golden cohort.
Three inputs behind the ratio
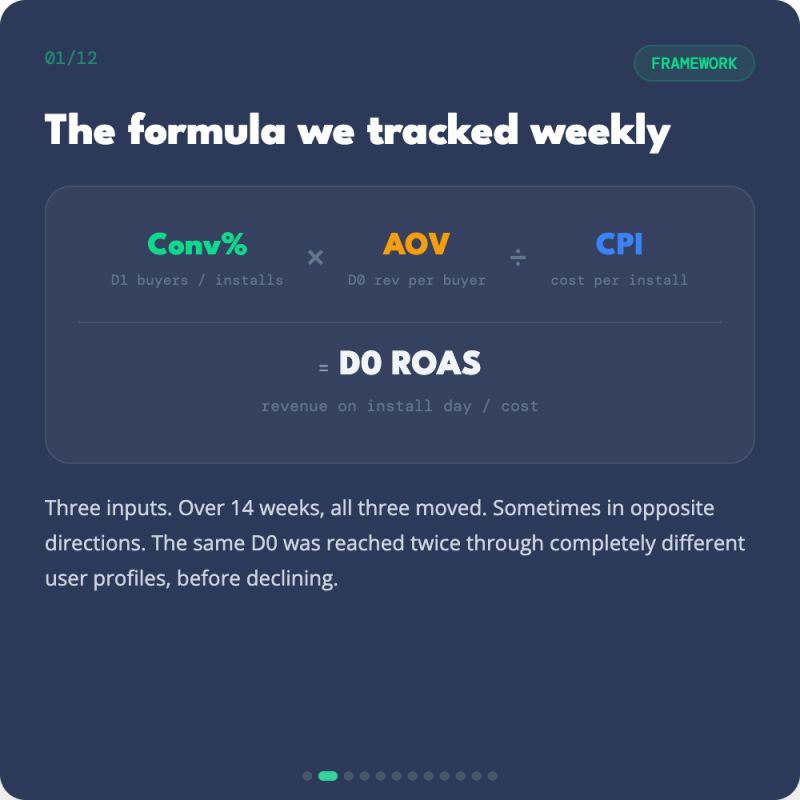 Over 14 weeks all three inputs moved, sometimes in opposite directions. The same D0 came twice from different user profiles before it declined.
The formula I tracked weekly was D1 conversion × AOV ÷ CPI = D0 ROAS. It is a ratio with three moving parts, and reading it as a single number hides which part moved.
| What moved D0 | CPI | D1 conversion | AOV | D0 ROAS |
|---|---|---|---|---|
| Weeks 1 and 2: cheap installs | £4 to £6 | 10% | £10 | 23% |
| Weeks 6 and 7, after a store feature: bigger orders | £10 | 8% | £29 | 22% |
| Then: falling value per buyer | Barely moved | Not reported | £29 to £25 to £23 to £18 over four weeks | 22% to 11% |
On the rounded figures, the formula gives about 17% to 25% for weeks 1 and 2 and 23.2% for weeks 6 and 7, close to the D0 in the table.
The first two rows were the surprising part. The same D0 above 20% came from two different user profiles. Early on, CPI carried everything. AOV was modest and did not need to be more than that. After the store feature, CPI doubled but AOV tripled.
Then the input that mattered moved
The last row is where it broke. AOV fell at every step, on the same campaign, the same setup, and the same optimization objective.
Value per buyer did most of the damage, and CPI barely moved.
Why this is hard to diagnose on iOS
On this game’s iOS value optimization, the signal Meta optimized on was D0 revenue. If that revenue changes for reasons on the product side, such as offers, eCPMs or engagement, Meta’s targeting shifts with it.
It is a feedback loop, with the revenue as the signal.
Meanwhile the numbers across the whole game said this was more than an acquisition problem. ARPDAU dropped 30%, IAP per user was down 33%, ad revenue per user down 25%. Revenue per active user was softening across the entire player base.
The revenue mix had shifted too. Week 1 was 85% IAP. By week 6 it was an even split between IAP and ad revenue, which meant AOV now depended on ad eCPMs as much as on purchase behavior.
The one number that held
Cost per purchase (CPP) turned out to be the number that held. While CPI, conversion, and AOV all moved independently, it captured both acquisition cost and conversion in a single figure.
D0 landed above 20% in every week that CPP came in under £30, and missed that mark in every week CPP did not.
If you track one number daily, that is a strong candidate. Do not expect it to tell you which of the three inputs moved, because that is what the decomposition is for. On a different account, when I ranked 38 campaigns both ways, day 0 value predicted day 28 ROAS better than cost per purchase.
Before you blame acquisition
When D0 ROAS drops, check these in order.
- Split D0 ROAS into D1 conversion, AOV, and CPI, and find which one moved.
- On iOS value optimization, check for changes on the product side that moved D0 revenue.
- Check revenue per user across the whole game.
- Check the revenue mix.
The full diagnostic, from the change log to the budget decision, is in why is my CPI rising or ROAS stalling.
Data limits
The weekly figures are rounded, from one account, with conversion measured at D1 and revenue at D0.