On tROAS campaigns I track one thing most people do not: hit rate, the number of days the algorithm delivered what I asked for. I read it alongside the overall average.
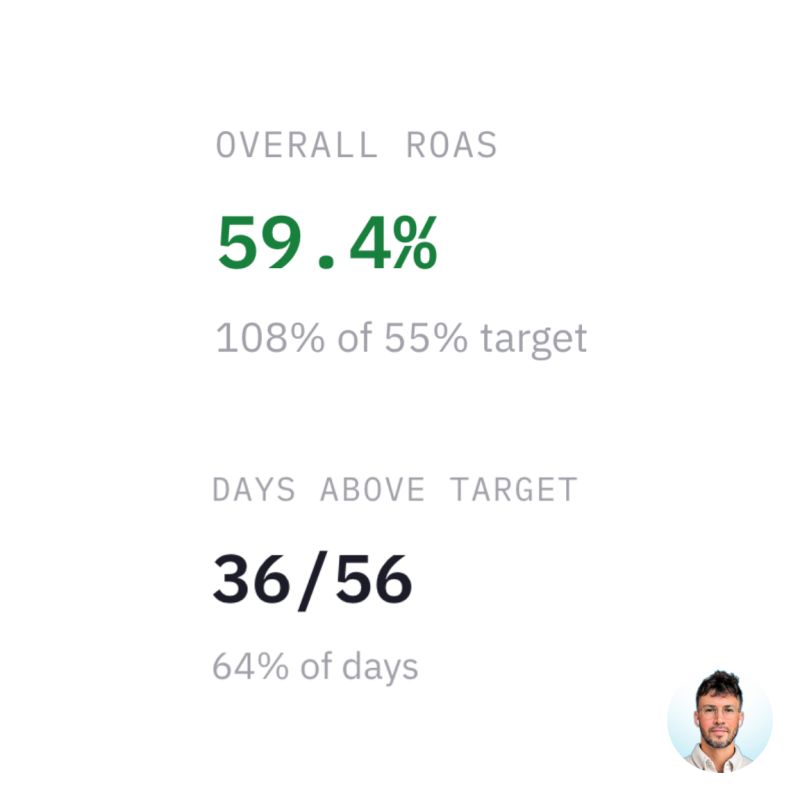 One subscription app, 56 days on Meta tROAS against a 55% target.
Two numbers come out of that:
| Metric | How I calculate it | This account, 56 days | What it misses |
|---|---|---|---|
| Blended ROAS against target | Overall ROAS for the period, divided by the tROAS target | 59.4% ÷ 55% = 108% of target | It hides how many days reached the target |
| Hit rate | Days above target, divided by days in the period | 36 ÷ 56 = 64% of days | It counts days, so a low spend day weighs the same as a high spend day |
I use the blended figure for where the whole period landed against the target, and hit rate for how often a single day got there.
When the algorithm keeps overshooting
In this account it consistently overshot what I asked for. If it delivers 108% of your target, why not raise the target? Most accounts never get around to asking.
The two levers do different things.
- Budget scaling says “find me more people like this”.
- Raising the target says “find me better people”.
Most teams reach for the first one automatically because it feels like growth. But an account that clears its target on two days out of three is telling you the target sits below what the account can do. More budget at the same target buys more of the same cohort. A higher target usually buys less delivery, so raise it in steps and watch whether spend and payer volume hold.
Hit rate makes that visible. A single blended ROAS figure at the end of the month averages the signal away. One blended tROAS number did the same when it hid a country running far below target for three months in an account I audited. Read hit rate next to the blended figure. On the days that miss, also check how far below target they landed and how much of the spend sat on them.